These properties specify the axis position and color.
type
TRVReportBarAxisPosition =
(rvrbapAuto, rvrbapMiddle, rvrbapSide);
property AxisPosition: TRVReportBarAxisPosition;
property AxisColor: TRVColor;
AxisPosition is taken into account only if MinValue < 0. Otherwise, all bars are started from a side (for example, if BarDirection = rvrbdRight, bars are started from the left side), and an axis is not drawn.
AxisPosition |
Meaning |
Example |
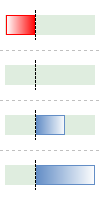
rvrbapAuto |
Axis position is calculated automatically from MinValue and MaxValue Bars for positive and negative values are shown in the opposite directions.
|
|
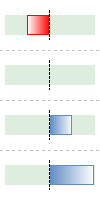
rvrbapMiddle |
Axis is always at the middle. Bars for positive and negative values are shown in the opposite directions.
|
|
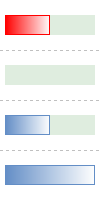
rvrbapSide |
Axis is at a side (and is not shown) Bars for positive and negative values are shown in the same direction
|
|
In the table above, examples use the following data:
-50 |
0 |
50 |
100 |
AxisColor specifies the color for drawing an axis line. If AxisColor = rvclNone, an axis is not drawn.
Axis is drawn on margins as well.
Default values:
•AxisPosition: rvrbapAuto
•AxisColor: rvclBlack